Configure an Analytics Pipeline
Within the Analytics Workbench, you have the capability to effectively configure a data analytics pipeline by defining essential components such as input data (input blocks), data manipulation functions (data preparation), Machine Learning (ML) or Deep Learning (DL) algorithms for data analysis, control functions (for-loops), and output data (output block) for storing the analysis results. This configuration is achieved by connecting various pipes/function blocks in a visual manner, using easily configurable blocks that are interconnected to form the final data analysis pipeline. To design a complete data analytics pipeline, three main views are available to visually support configuration, validation of changes on the data sample after each step in the pipeline, and configuration for visualizing the results.
Step-by-step Task Configuration (Graph View)
The Graph View of the Analytics Workbench enables you to visually design an analytics pipeline, as illustrated in the figure below.
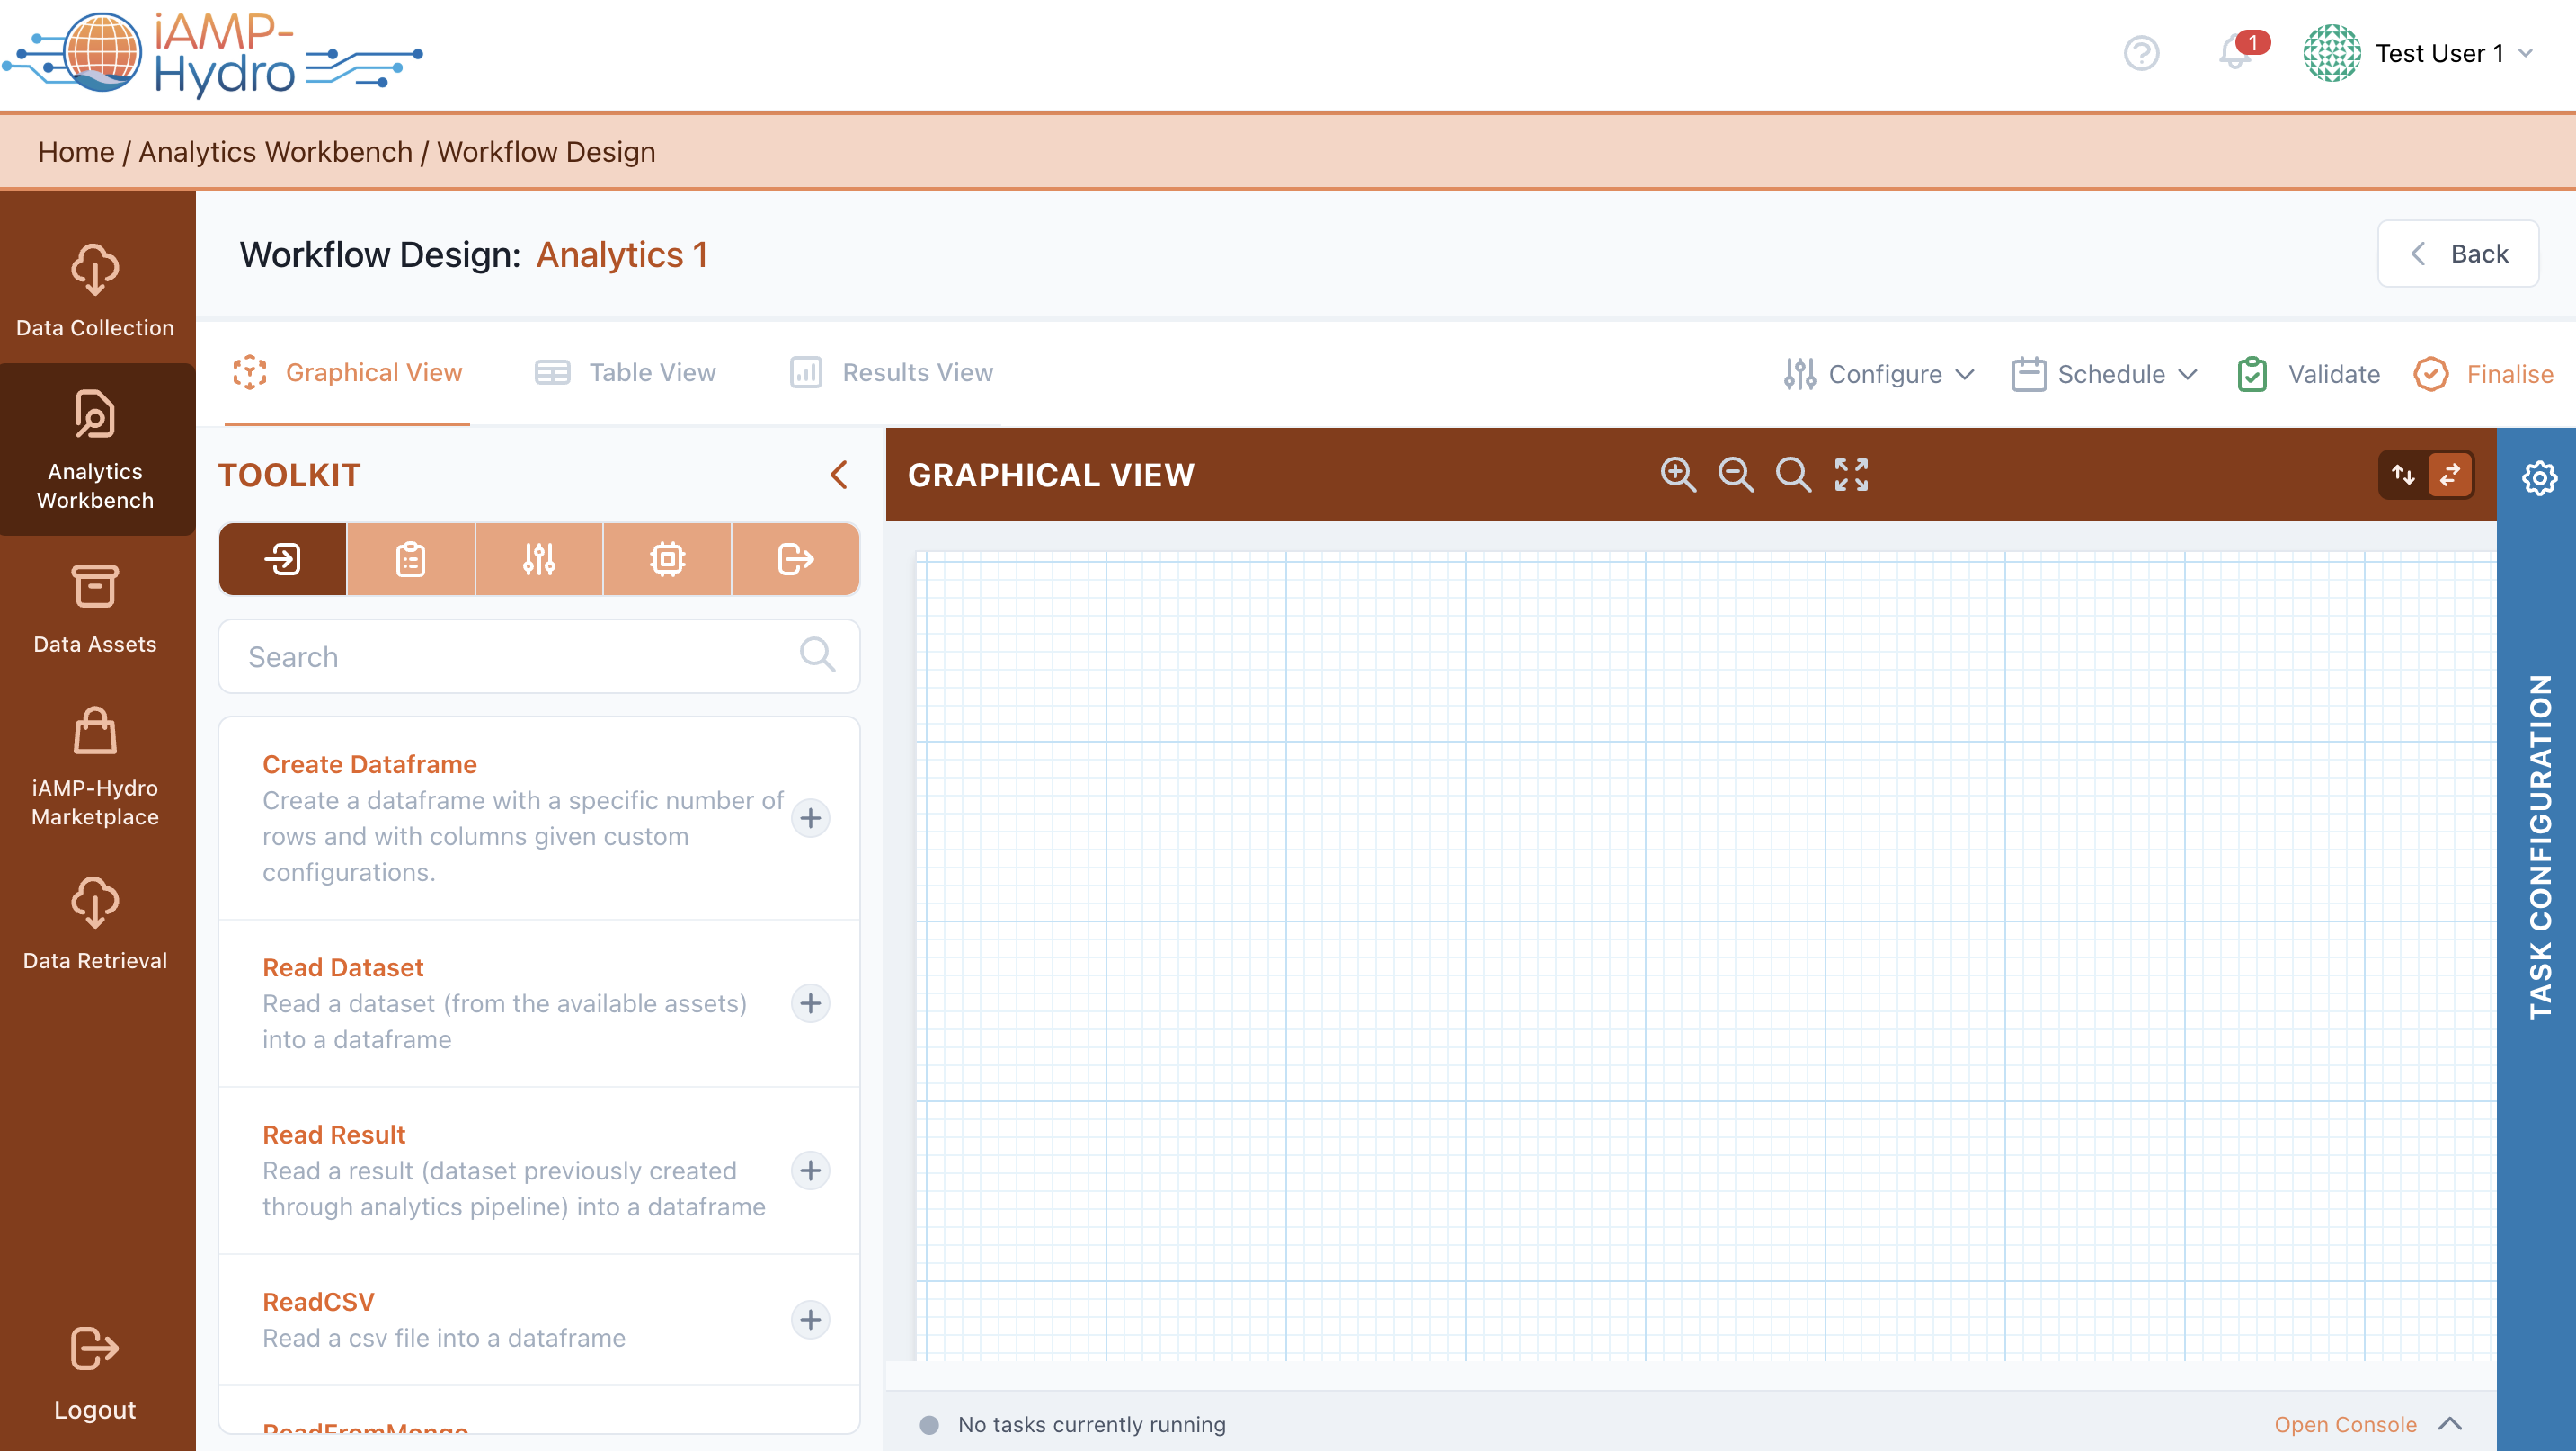
Using the Toolkit located on the left side of the view, you can search, browse, and filter for relevant blocks for your pipeline, including input blocks, data preparation blocks, machine learning (ML) / deep learning (DL) blocks, and output blocks. Upon selecting a relevant block from the Toolkit, you can add it to the main Graph View. When a block is added, it appears in the main Graph View without any connections (directed arrows between blocks). Connections between blocks are configured in the right slide-over.
For instance, you should define the method for reading input data by adding a specific input block (e.g., Read Dataset for stored data assets, or Read Result for existing results from other data analysis pipelines). Parameters associated with the selected block are inserted in the right slide-over after the block selection. Subsequently, you may define data preparation rules by adding various processing functions (e.g., sort, drop null values, etc.). Optionally, after adding appropriate input and data preparation blocks, you should select any relevant machine learning or deep learning blocks based on the intended analysis.
Machine learning and deep learning blocks are categorized based on their use (e.g., evaluate, train, or apply), with available algorithms (e.g., Binary Classification, Regression, Clustering, etc.) allocated accordingly. Supported libraries include sklearn, Spark MLlib, Keras (Tensorflow), pmdarima, Statsmodels, and XGBoost.
Finally, you define the output block that determines how data will be stored.
In the Toolkit View, selecting a block allows you to view and modify the block description, see the type and version of the block, define block connections (i.e., upstream tasks, downstream tasks), and define parameters based on block type. Selecting the Save button executes a quick run over the sample configured block to propagate data structure to the next block, with a relevant status icon appearing on the right side of the block in the Graph View. Once blocks are configured correctly, a Valid icon appears at the top bar of the Analytics Pipeline View.
Available actions in blocks include test run for executing the pipeline up to a specific block for a small data sample, and settings to edit or delete a block from the pipeline. Validation errors in the pipeline, if any, are displayed in the appropriate blocks, with a summary of validation results shown in the Validation Results.
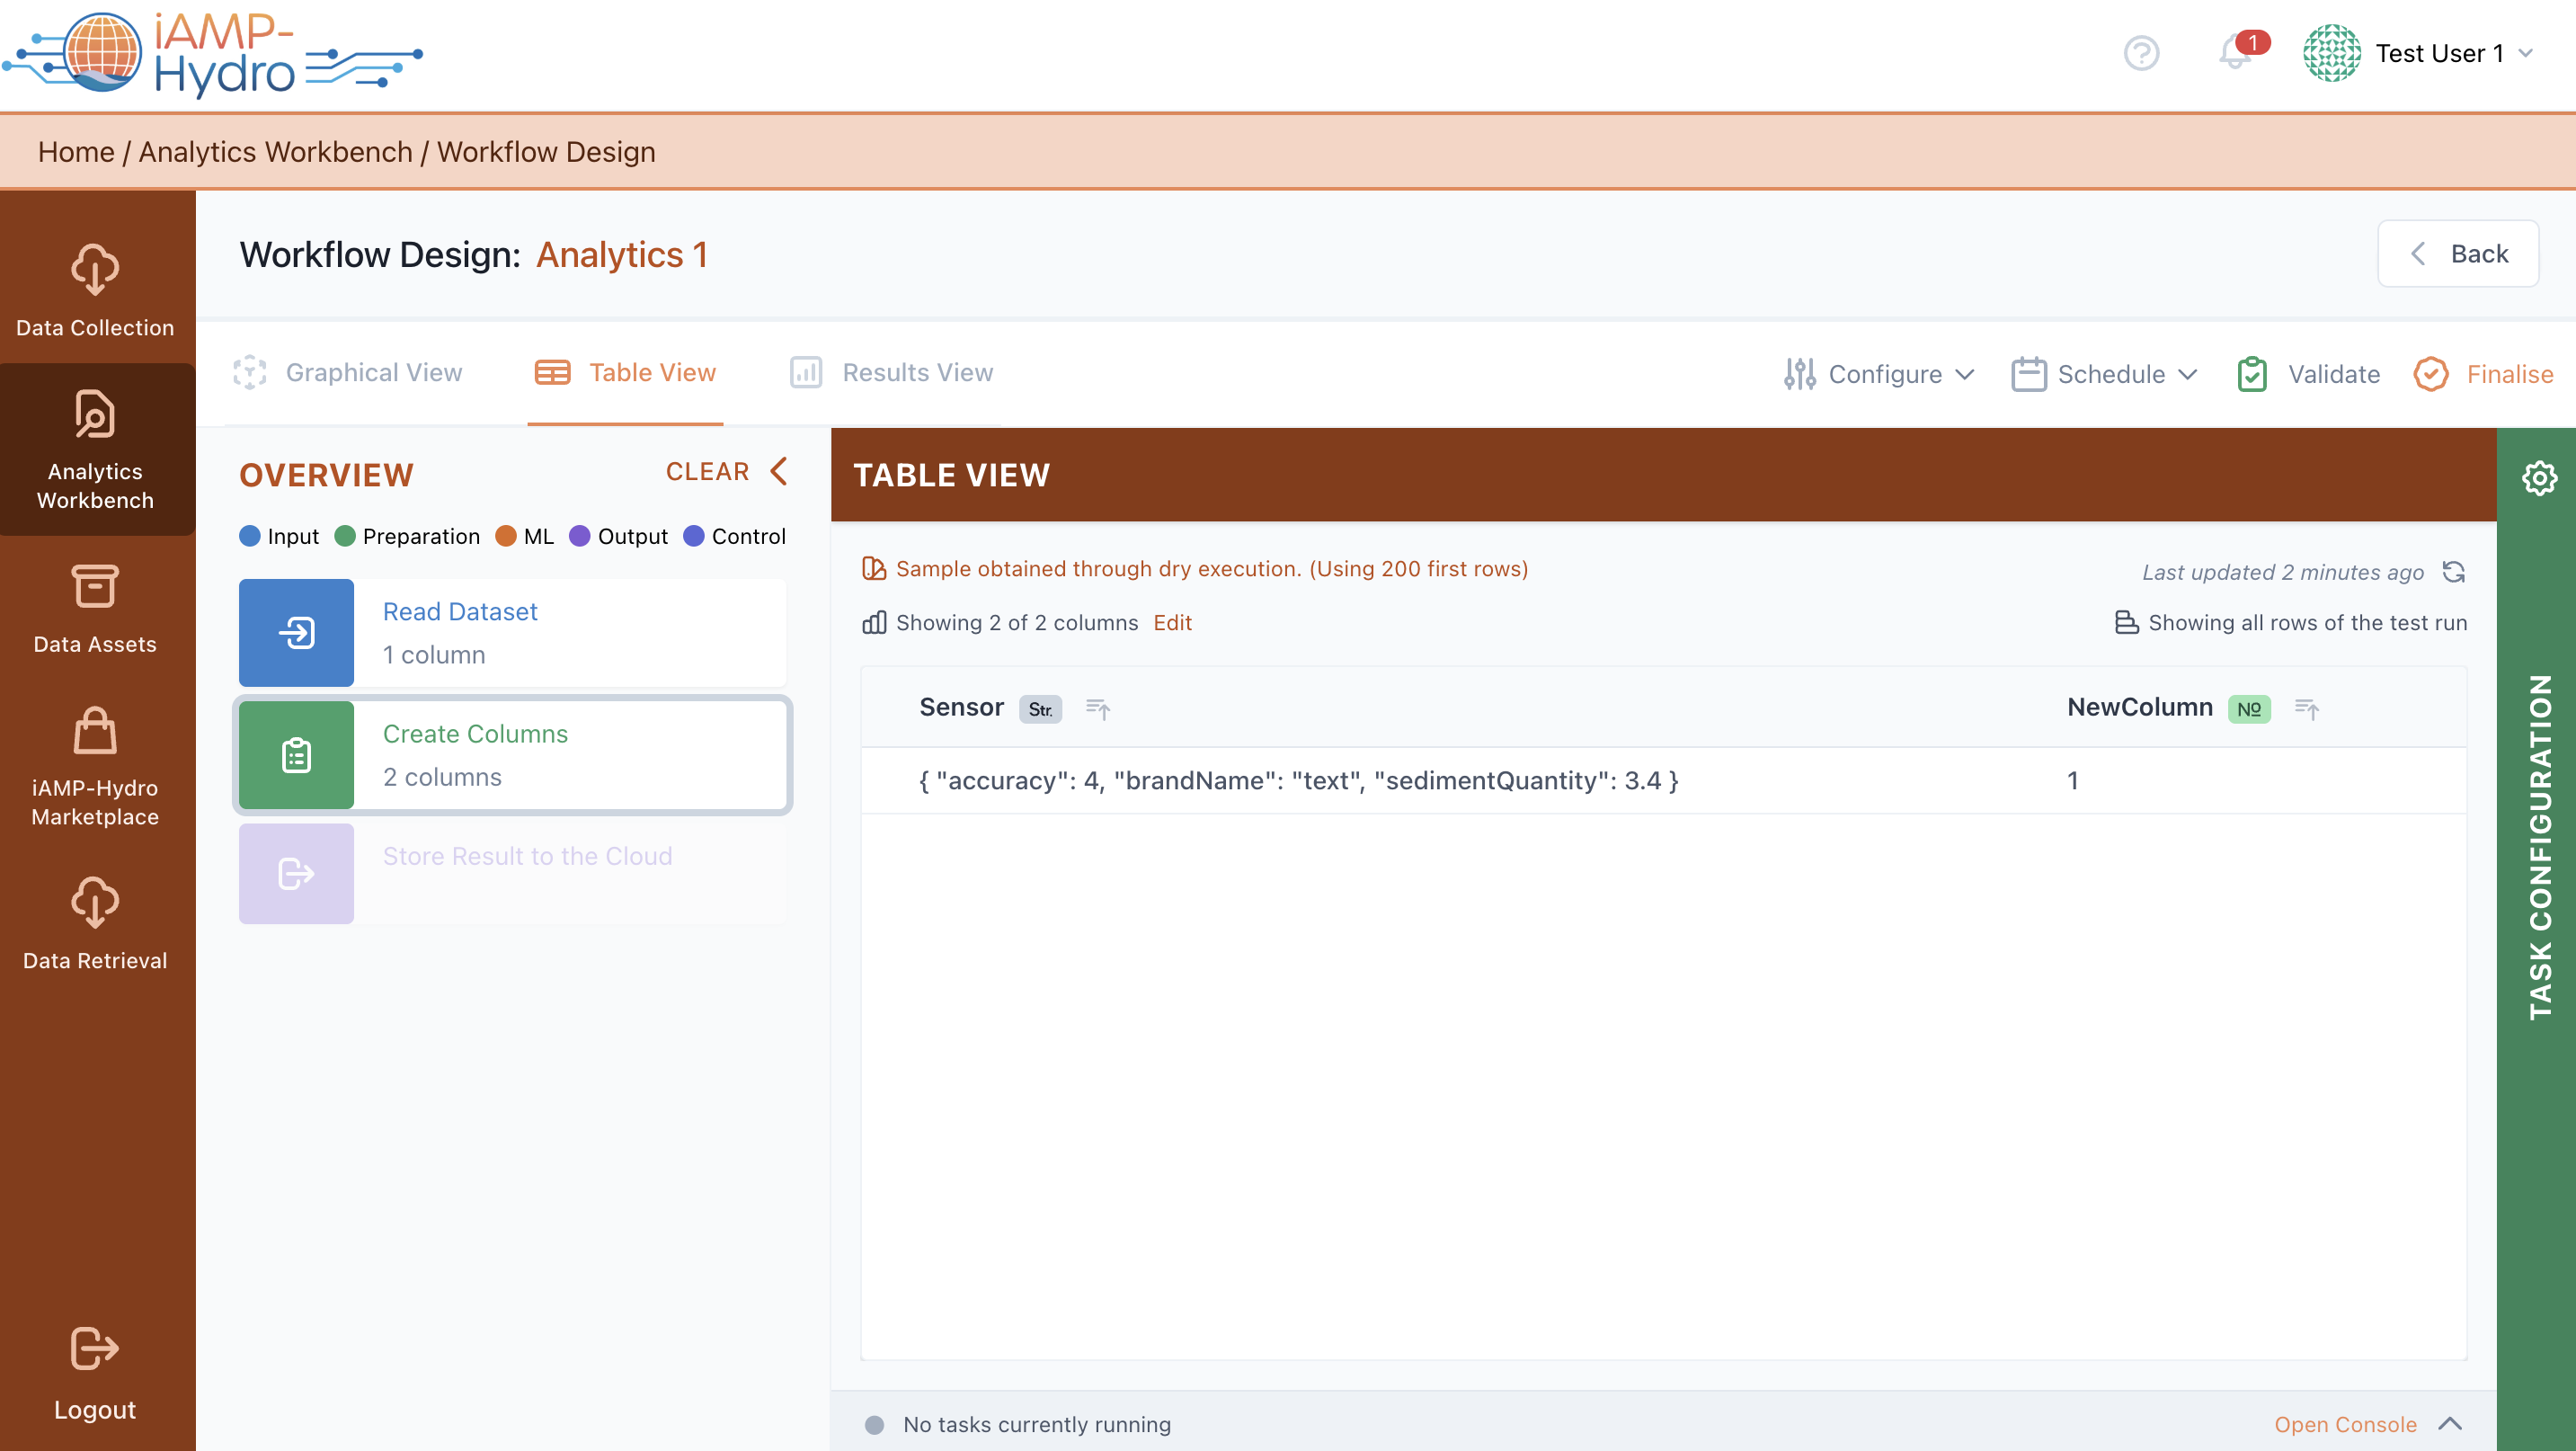
View Test Results (Table View)
In the Table view, you can obtain an overview of a data sample and how data change each time they are processed following the path of blocks till the current, selected block. You can view all pipeline blocks in the left slide-over, and by selecting a block, the corresponding workflow is highlighted, with test run results appearing in the main Table View. Additionally, you can change any settings you want by selecting a particular block. In the main Table View, you can view the different outcome columns, sort them, search for specific values, or resize/reposition them.
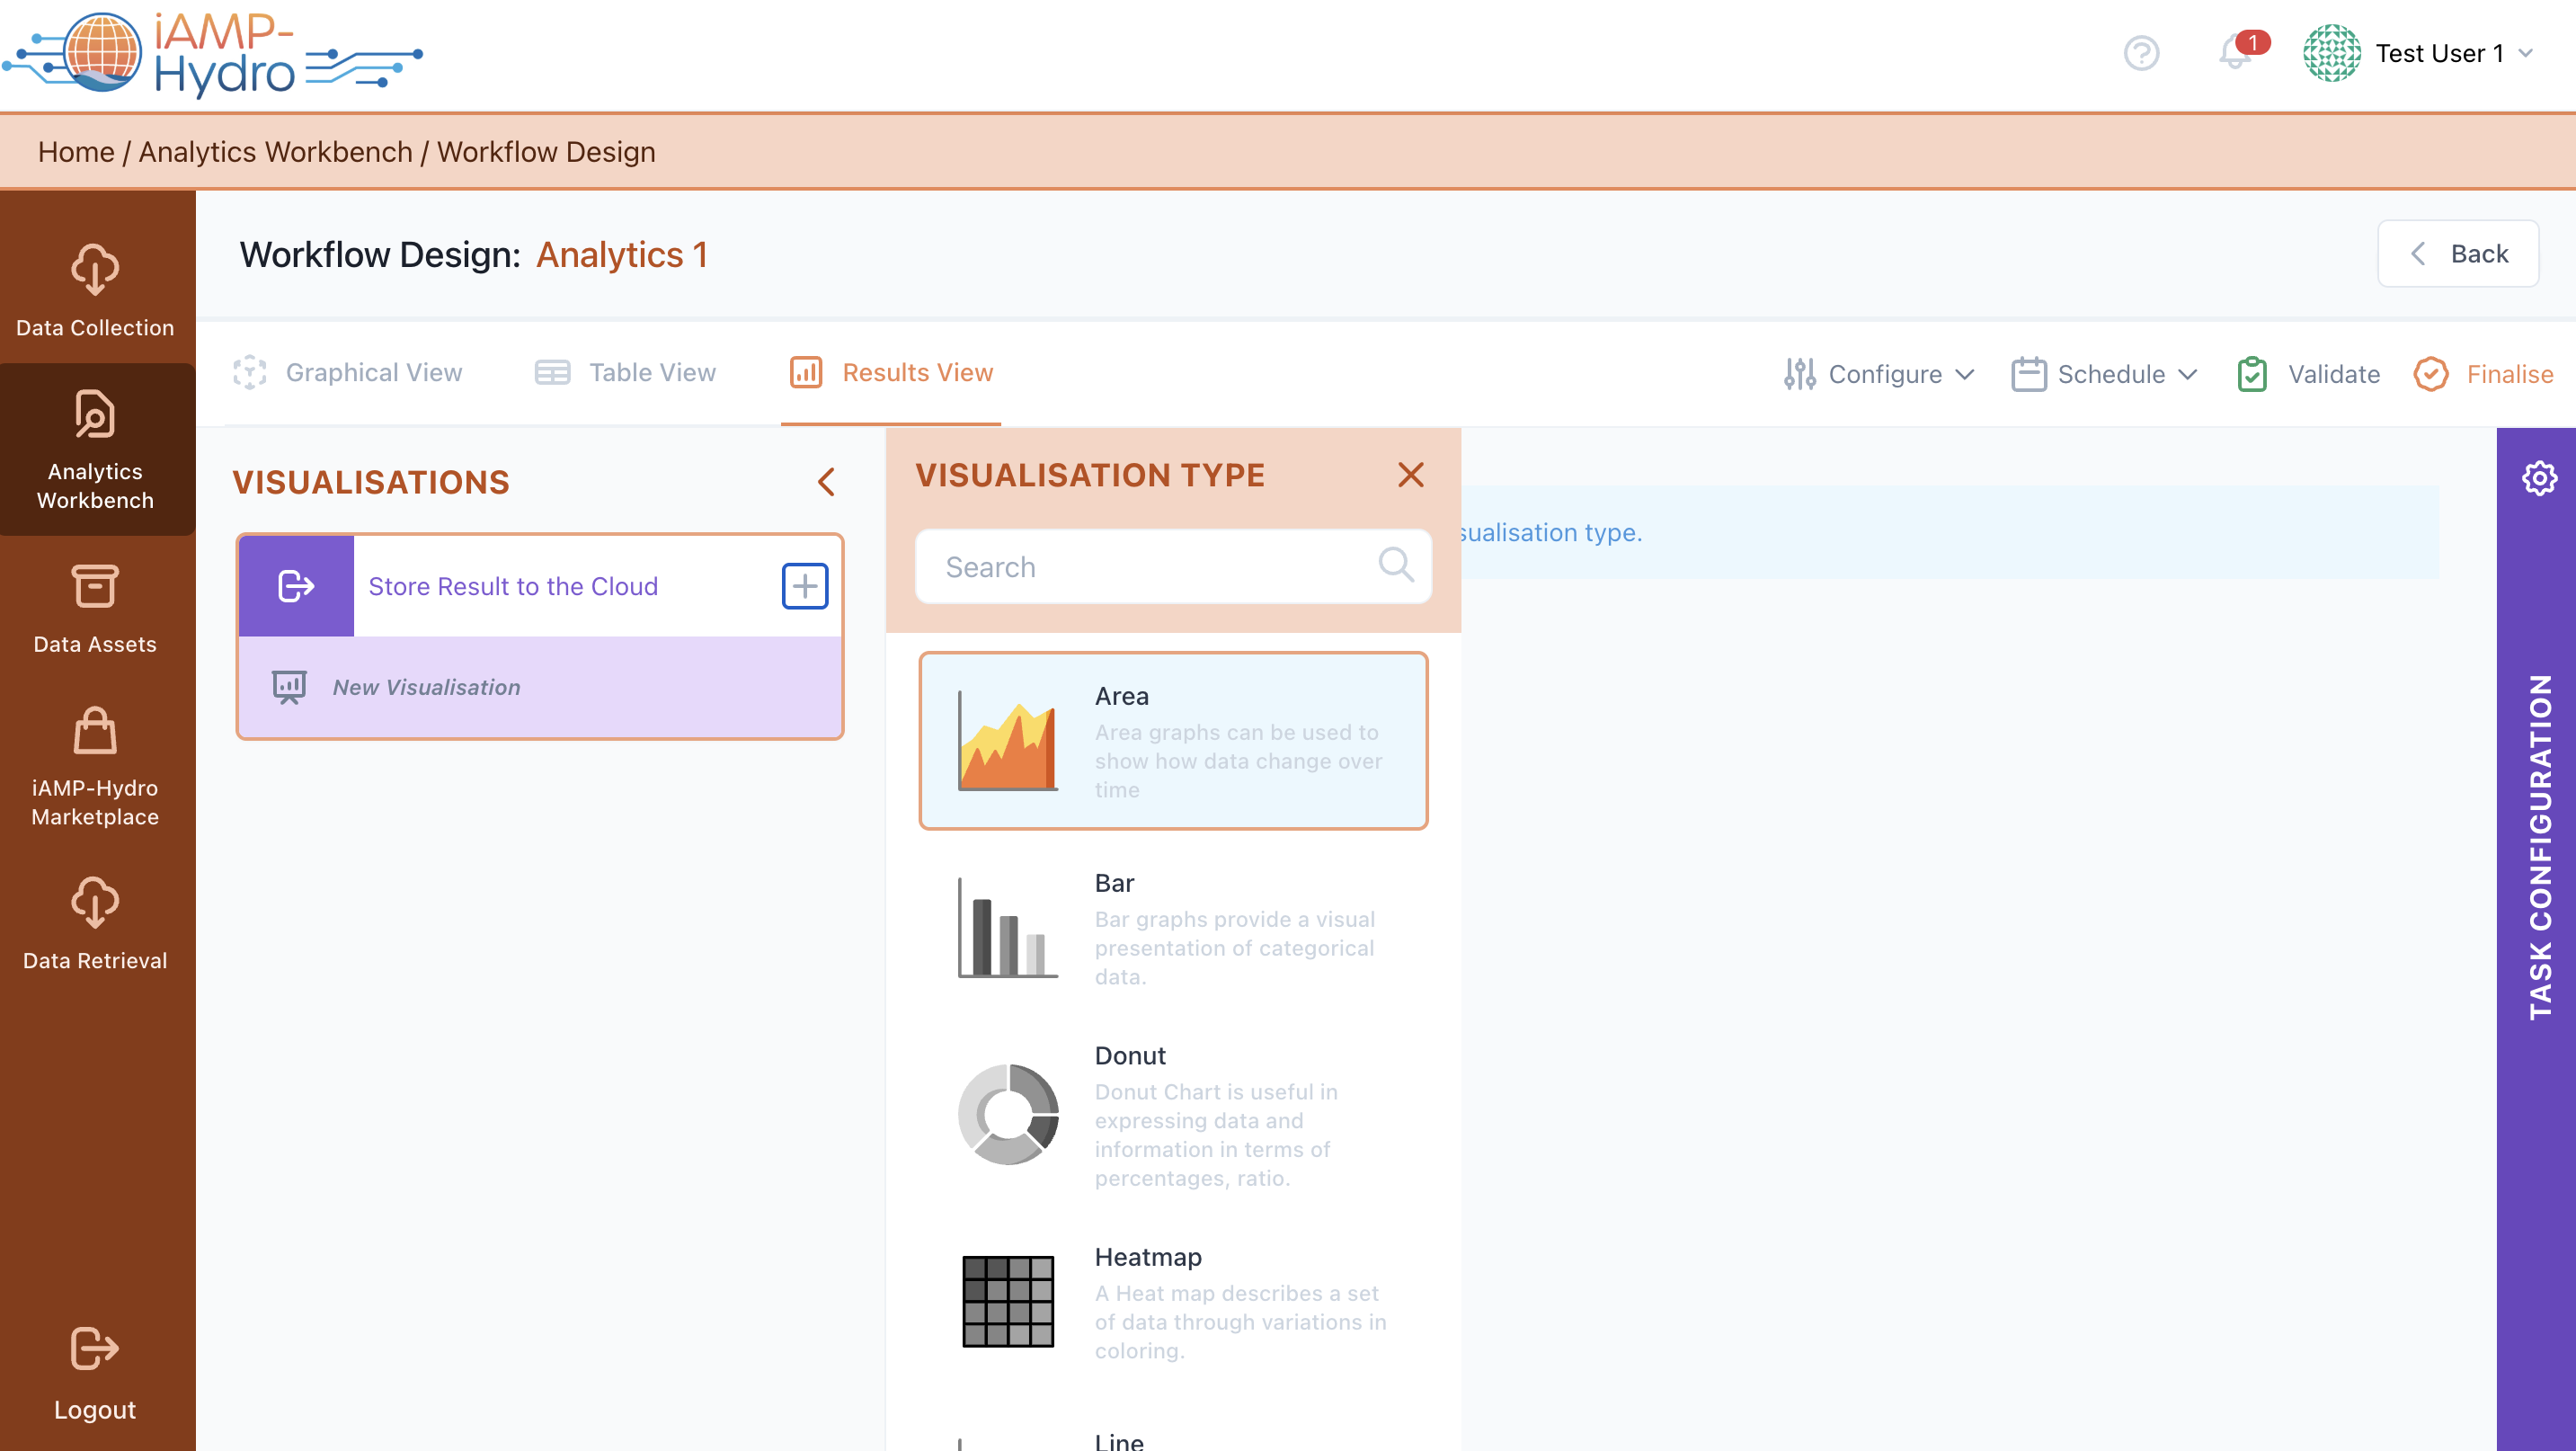
Configure a Visualization (Results View)
Once you are satisfied with the configured data analytics pipeline, you can define the desired output/visualization of results from the Results View. You can select the output block for visualization, then choose the type of diagram from the left slide-over menu, which includes various visualization types such as line graph, scatter plot, and bar chart. Next, you need to configure the necessary parameters for visualization, including title, legends, axes labels, and other options such as grids and tooltips. Once the configuration is performed, the visualization is available and visible at the center block of the screen with the test run results (note: the results are not properly sorted).
Hints
- It is possible to add more than one graph per output block.
- You may save the visualization configuration. Once this done, the visualization is made accessible through the pipelines overview page.
- You are able to edit the configuration parameters at any moment (selection of extra visualization blocks/updates on the visualization configuration details etc…)
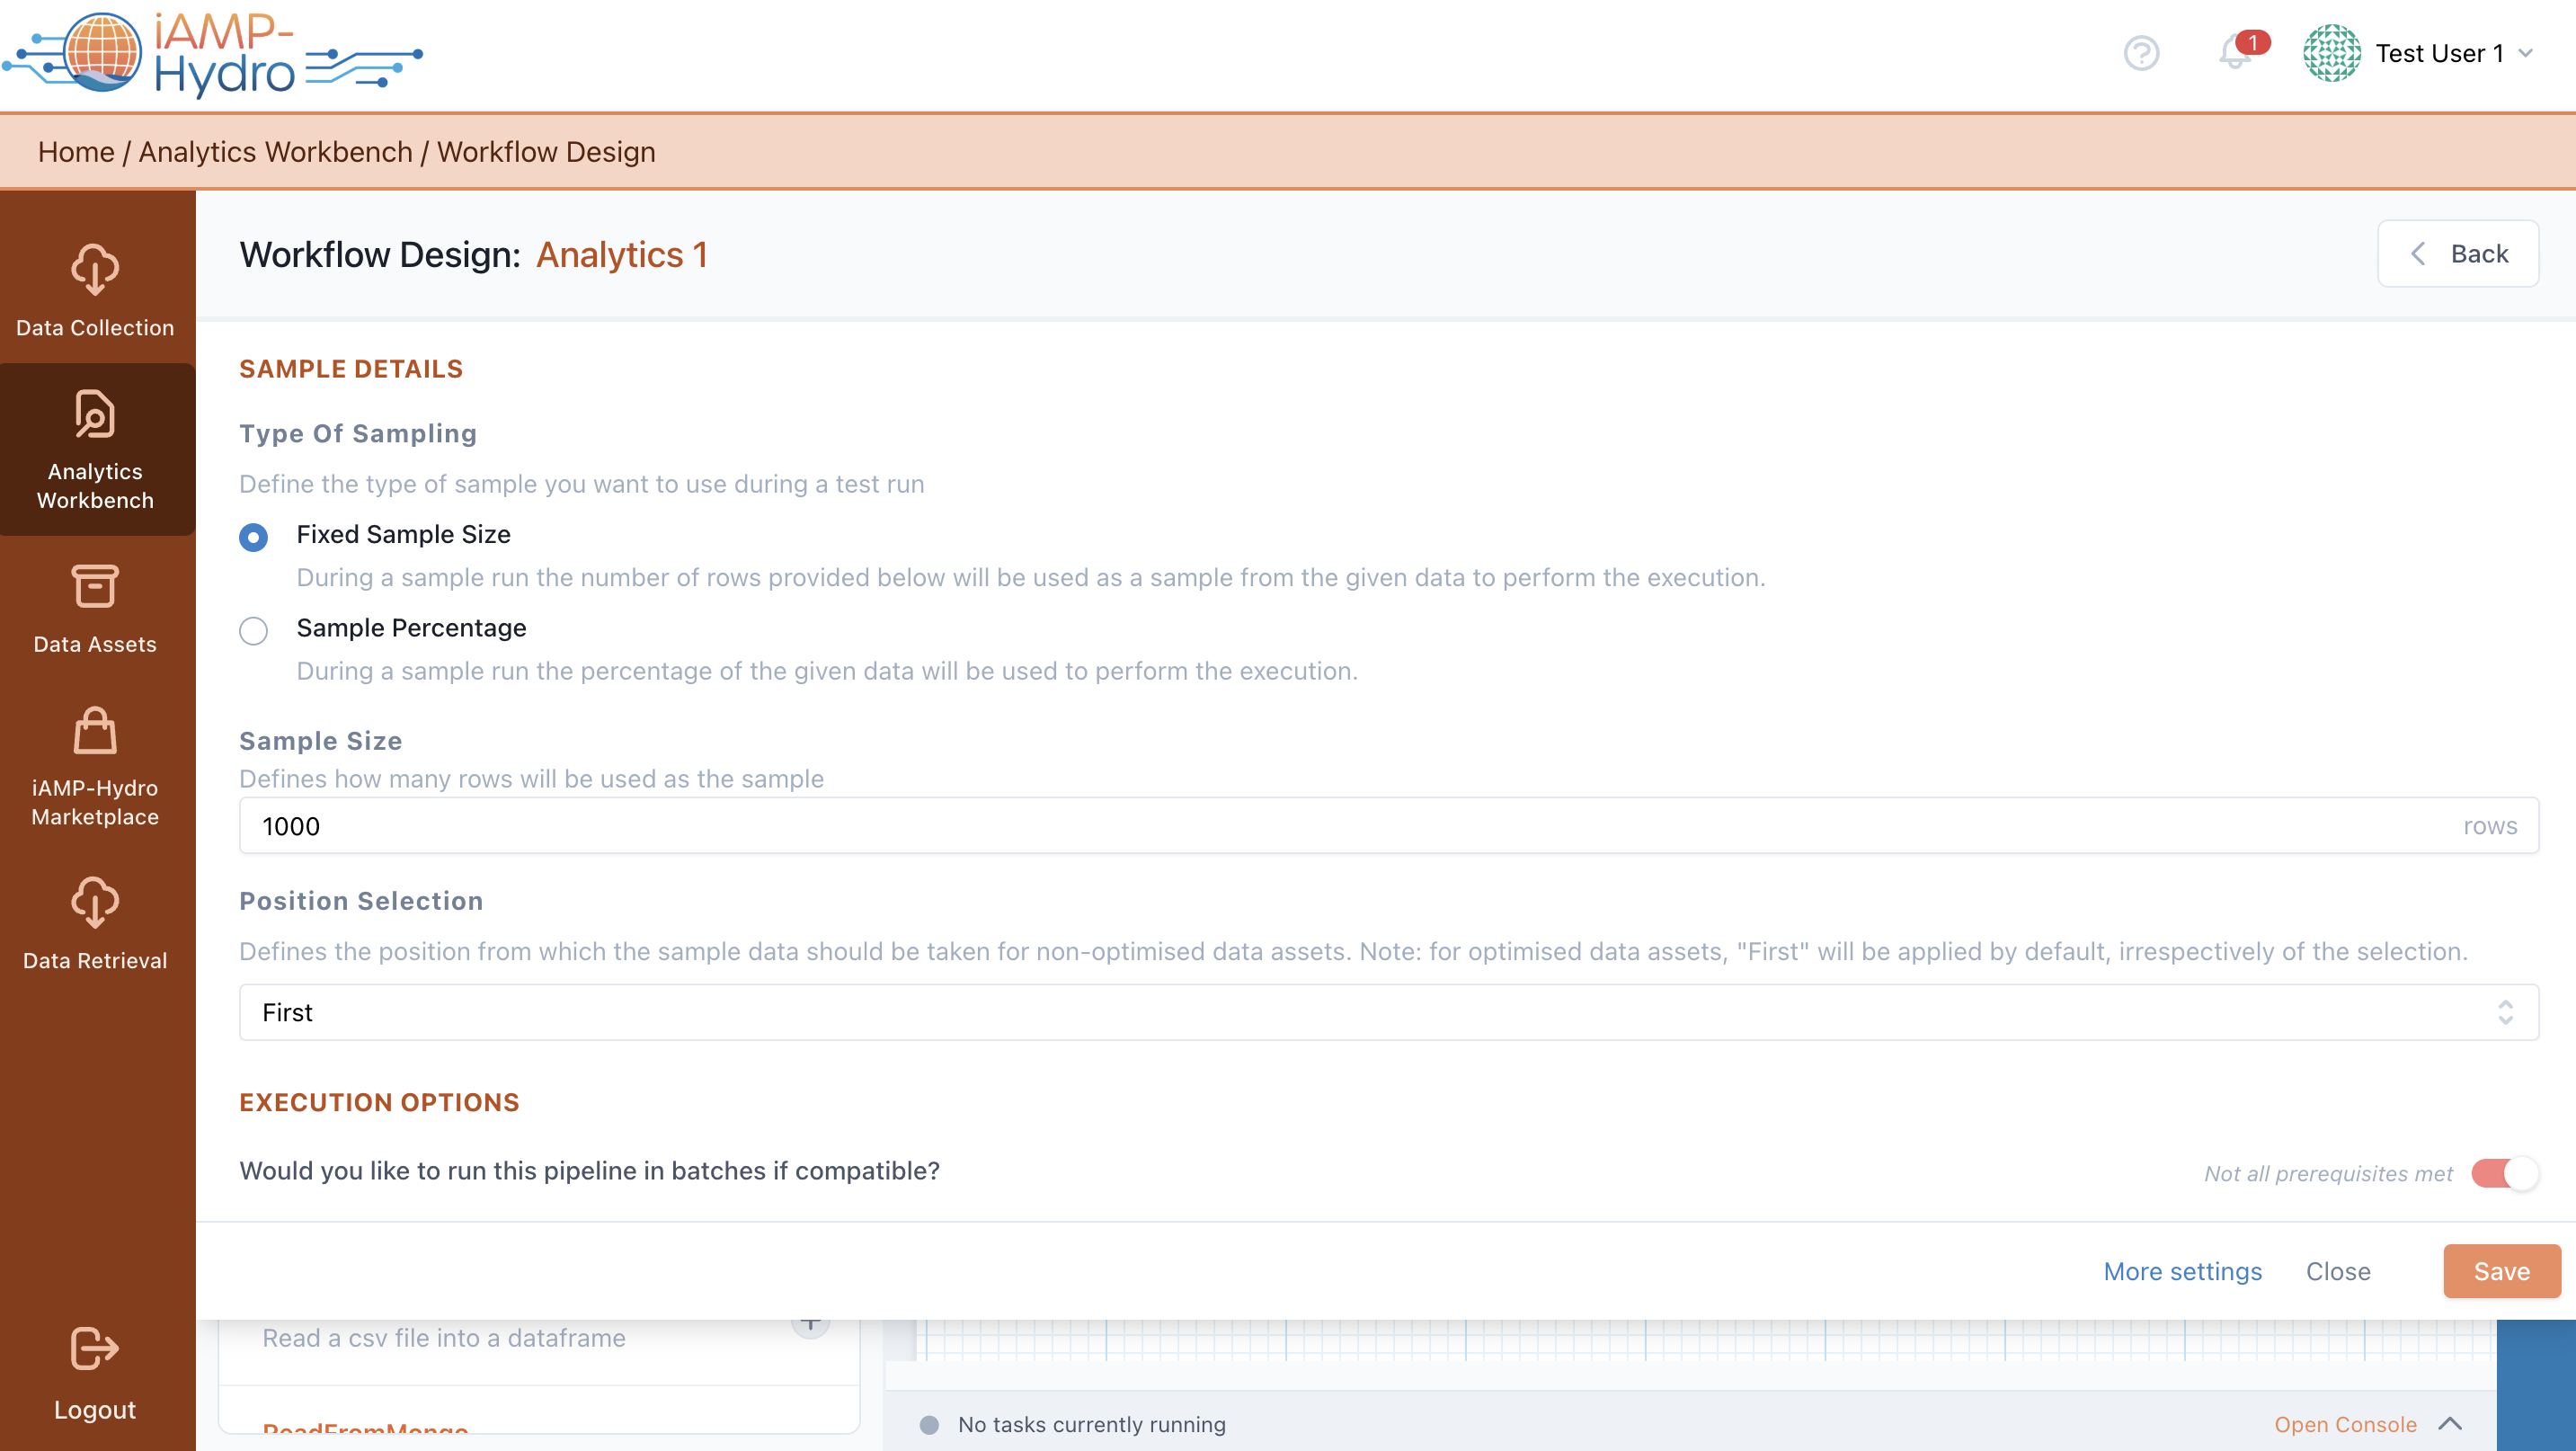
Apply the necessary Settings
Apart from configuring different input, processing, analytics, and output blocks in an analytics pipeline, you can also configure the pipeline settings by selecting the Configure option from the Analytics Workbench bar. A top slide-over is displayed allowing you to define the sample details (type of sampling, sampling size, and position selection) for the test run.
In addition, in case the pipeline can run in batches (note: this is automatically determined depending on the blocks you have included in the pipeline), you are able to opt for such an execution to ensure that it can be successfully executed even for large datasets.
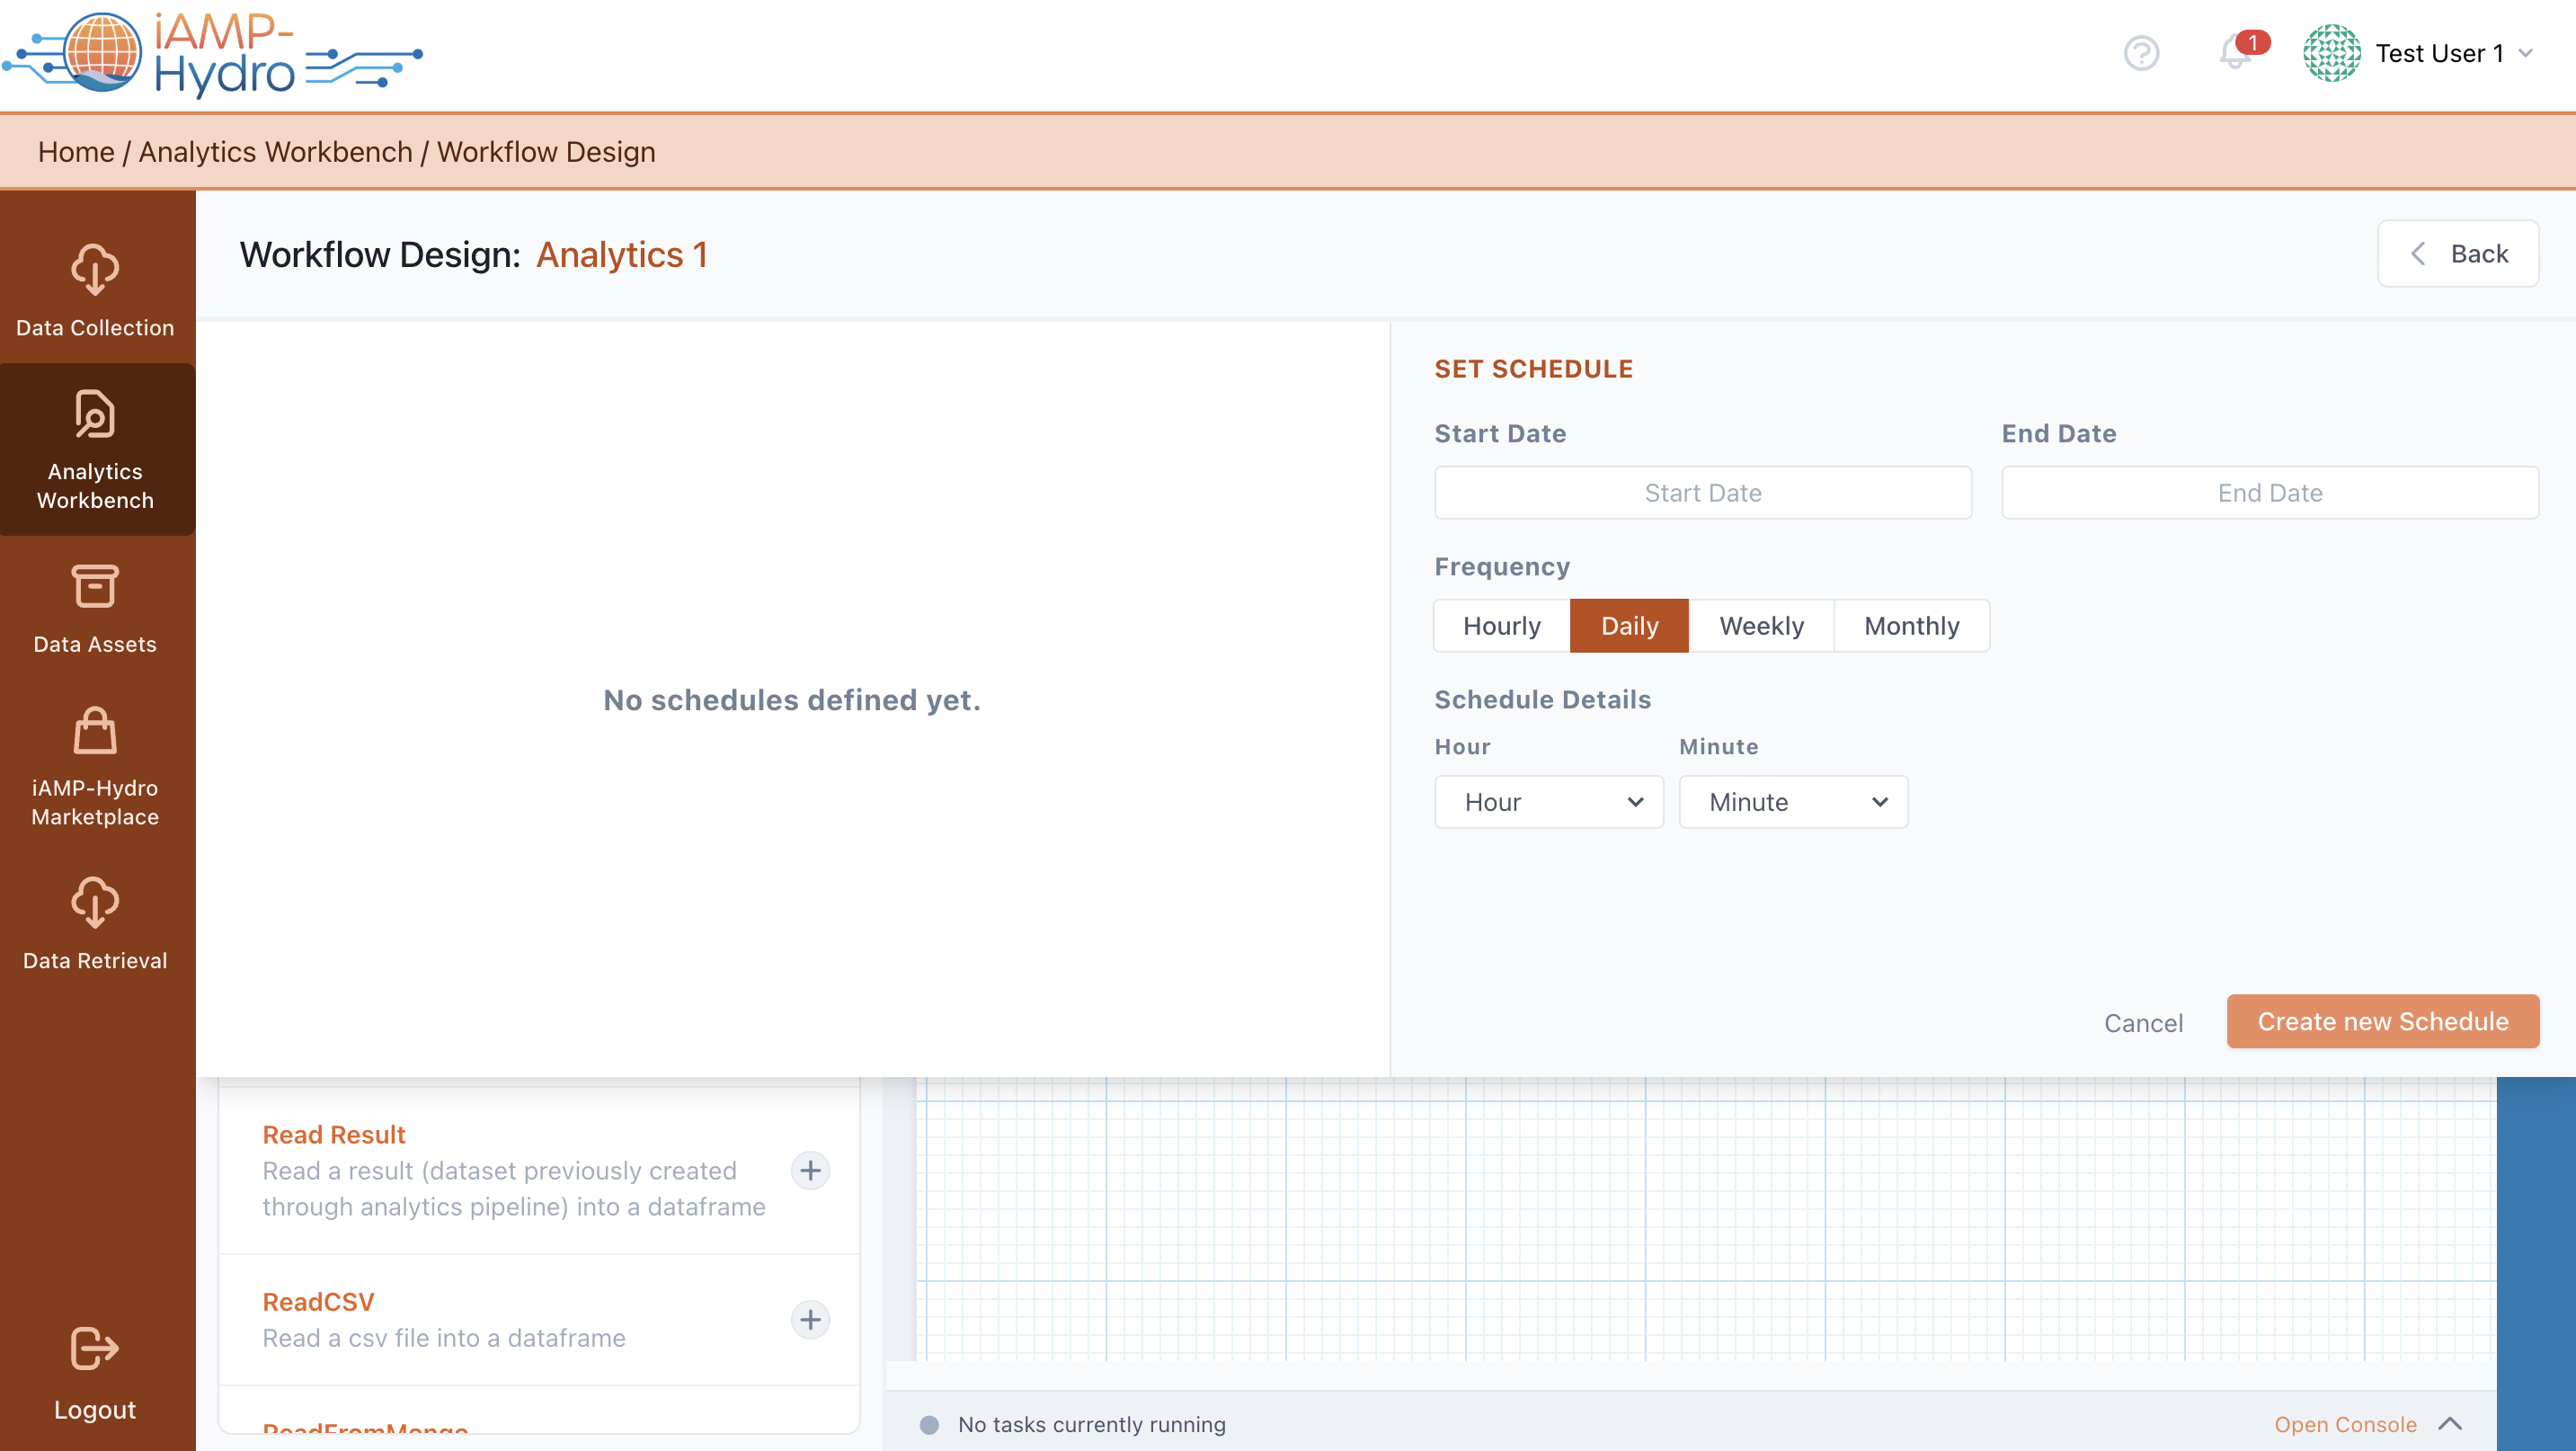
Schedule the Execution
You can plan the execution of a data analytics pipeline according to your needs. In particular, you can plan the future pipeline execution either through scheduling (by selecting the schedule option) or upon a specific event configuration from the Analytics Workbench bar. A top slide-over allows you to define: (a) a schedule (or multiple schedules), selecting the execution period (start date, end date), execution frequency (hourly, daily, weekly, monthly), and exact execution time depending on the frequency, (b) the exact event condition(s) that have to be met in order to trigger the execution of the pipeline. At any moment you can activate/deactivate, edit and delete the configured schedules and/or triggers.